For many teams, critical performance data is locked in separate spreadsheets, apps, and dashboards. This fragmentation makes consistent tracking and reporting a slow, manual chore. It hurts your operational efficiency and blindsides decision-makers.
This is where a modern software solution makes a dramatic difference. Used by over 20,000 scaling teams, one platform drives results like a 55% increase in sales and a 60% reduction in time spent creating reports. It removes complicated setup and steep costs, offering self-service intelligence.
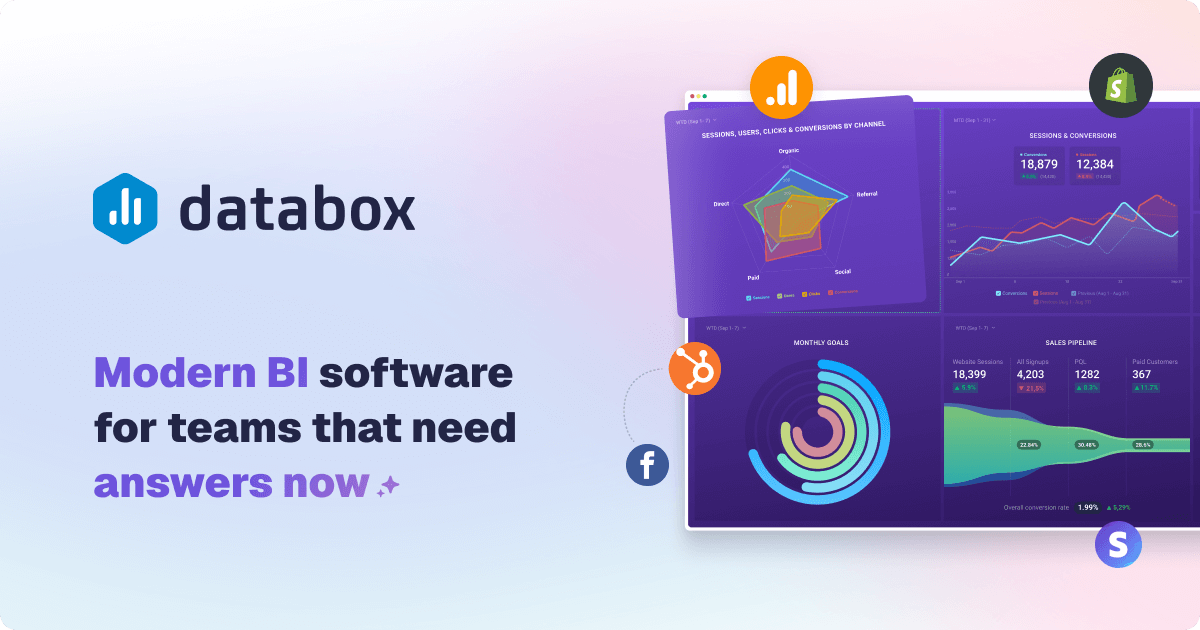
The tool connects all your data sources into a single view. This streamlines the entire process and saves valuable time. The right way to work is to focus on analysis and action, not just collection.
This expert review provides a comprehensive look at this platform. We will examine its features, pricing, and suitability to help you determine if it meets your specific business needs for data-driven decision-making.
Key Takeaways
- Business intelligence software transforms scattered data into a unified view for performance tracking.
- The right tool can significantly reduce the time and cost associated with manual reporting processes.
- Self-service platforms empower users to build dashboards and reports quickly, without a steep learning curve.
- Centralizing data sources leads to more efficient analysis and clearer, actionable insights.
- Scalable solutions are proven to drive measurable business results, like increased sales and operational efficiency.
- Evaluating a BI tool requires understanding how it integrates with your existing workflows and data ecosystem.
- The ultimate goal is to shift focus from data collection to strategic analysis and informed decision-making.
What is Databox? Transforming Data into Decisions
The journey from fragmented data points to unified strategic insights defines modern business intelligence. This platform began as a dashboard visualization tool. It has since evolved into a comprehensive, do-it-yourself analytics suite.
The transformation addresses a critical need for many organizations. Teams require easy access to insights without relying on technical staff. This self-service model empowers everyone to participate in data-driven decision-making.
From Dashboards to Full DIY Business Intelligence
The initial service focused on pulling data into simple visual dashboards. A major release marked its shift to a full DIY Business Intelligence platform. This introduced powerful new features for advanced analysis.
Key additions include Datasets for data preparation and a no-code SQL builder. These allow users to clean, merge, and query information directly. The platform now guides you through a complete workflow.
This process is broken into logical steps: Connect, Prepare, Visualize, Analyze, Report & Automate, and Plan. Each step builds upon the last, creating a seamless way to manage information. It turns raw numbers into actionable intelligence.
The Core Promise: No-Code Analytics for Everyone
The core promise is to make advanced analytics accessible to all team members. The interface is designed for non-technical users to perform their own analysis. This removes the traditional barrier of needing coding or SQL knowledge.
You can leverage the system without waiting for IT or a data analyst. This speed is a significant advantage for business agility. Teams can quickly respond to changes in key performance areas.
The tool integrates with a wide array of data providers. It pulls everything into a single place for unified management. This improves the communication of metrics across departments.
Automated alerts keep teams informed about critical usage trends. By simplifying the entire process, it changes how organizations interact with their data. The shift moves from reactive reporting to proactive performance management.
Databox Pricing: Plans, Value, and the Real Cost
The cost of a BI tool extends beyond its monthly subscription fee to include hidden factors like data connectors and user scaling. Understanding the total investment is crucial for budgeting and evaluating long-term value.
This platform uses a tiered pricing structure with five main plans. Each tier scales in features, data source limits, and sync frequency. The real expense often hinges on how many sources you need to connect.
Free Forever Plan: A Limited Test Drive
The Free Forever plan serves as a basic evaluation tool. It allows for up to 3 users and 3 data sources with daily syncs.
This level is suitable for simple metric tracking and platform testing. It provides a feel for the system without financial commitment. However, daily syncs may not meet all performance management needs.
Starter and Professional Tiers: For Growing Teams
The Starter plan, at $47 per month, supports 5 users and syncs data every 4 hours. It’s a step up for small teams needing more frequent updates.
The Professional tier, at $159 monthly, is a significant jump. It offers unlimited users and hourly data sync. This plan caters to teams that require broader access and more timely information.
A key point for both plans is they start with only 3 included data sources. This limit is a major cost driver for many accounts.
Growth and Premium: Enterprise-Grade Features
The Growth and Premium plans introduce advanced capabilities. Growth, at $359 per month, adds AI-enhanced analytics to the Professional features.
The Premium plan, priced at $799 monthly, is built for scale. It includes 100 data sources and offers a 15-minute sync option for up to 5 critical sources.
This tier also adds enterprise security and 24/7 support. It’s designed for organizations with complex data usage and high customer demands.
The Agency and Consultant Program
For firms managing multiple client accounts, a specialized program exists. It provides benefits like unlimited client workspaces and reusable branded templates.
An optional white-label add-on is available for a fully branded portal. The program also offers discounted per-source pricing. This can improve service delivery and profitability for customers.
Carefully assess your data source needs and required sync times. This way, you can determine the most cost-effective plan and avoid unexpected expenses.
Key Features and Capabilities of Databox
Moving beyond pricing, the practical power of any analytics solution lies in its specific capabilities for handling data from start to finish. This platform structures its features into a logical workflow.
Connect: 130+ Integrations and Custom Data Sources
The first step is gathering information. The Connect feature provides over 130 native integrations with popular business apps.
For custom needs, you can pull data via Google Sheets, CSV uploads, or direct API connections. This ensures you can access virtually any system.
Prepare: Data Cleaning with Datasets
Raw data often needs refinement. The Datasets feature handles this preparation process.
Users can clean, standardize, and merge data from multiple sources here. This builds a reliable foundation for analysis and improves overall efficiency.
Visualize: Drag-and-Drop Dashboards and Templates
Transforming prepared data into clear visuals is next. An intuitive drag-and-drop builder makes this simple.
You can choose from over 20 chart types. A library of 200+ pre-built templates accelerates setup and ensures consistent reporting.
Analyze: Drill-Downs, AI Insights, and Forecasts
Surface-level views are not enough. The Analyze suite provides deep investigative tools.
Drill down to row-level data, compare periods, and filter by dimensions. AI-powered insights automatically highlight trends and generate forecasts, saving valuable time.
Report & Automate: Scheduled and Live Reports
The final step is sharing knowledge. Reporting and automation features streamline this communication.
Create page or slide reports. Schedule them for email or PDF export, or send live alerts to Slack or mobile.
Shareable links provide instant access to a live portal. This way, stakeholders always see the current status.
These capabilities work together to simplify performance tracking. They put advanced data management directly in the hands of teams.
The Pros: What Users Love About Databox
Positive user experiences often highlight specific features that deliver immediate efficiency gains and long-term strategic advantages. Reviews consistently point to several standout strengths that make this platform a favorite for teams seeking self-service analytics.
These pros translate into tangible business benefits. They reduce the time to insight and improve cross-team communication.
Rapid Setup and Intuitive Dashboard Creation
The setup process is remarkably fast. Many users report creating a live, functional dashboard in under an hour.
This speed dramatically accelerates time-to-insight. The drag-and-drop interface is designed for clarity.
Even those with no prior data visualization experience can build useful views. This intuitive way of working lowers the barrier to entry for analysis.
Unlimited Users on Most Plans
A significant advantage is the inclusion of unlimited users on the Professional, Growth, and Premium plans. This policy eliminates per-seat licensing costs.
It encourages organization-wide adoption and data access. Teams can invite all stakeholders to view dashboards without budget constraints.
This fosters a culture of transparency and shared performance tracking. It is a powerful tool for improving internal communication.
Extensive Library of Pre-Built Templates
An extensive library of over 200 pre-built templates saves considerable time. These are designed for specific use cases and popular platforms.
Teams can deploy professional dashboards quickly. They don’t need to start from a blank screen.
This feature ensures consistency in reporting and accelerates the initial setup. It is especially valuable for common business areas like marketing, sales, and support.
Powerful Custom Metric and Data Blend Tools
The platform’s power shines in its custom metric tools. The Metric Builder allows users to create blended metrics and calculated KPIs.
You can combine data from multiple sources into a single, insightful metric. This enhances the depth of analysis possible.
It ends data silos by pulling everything into a unified place. The process supports more nuanced tracking of complex business needs.
Real-time data sync and interactive dashboards keep reports current. This supports timely decision-making as changes occur.
Automated alerts inform teams about critical usage trends. The overall efficiency in streamlining the reporting process is a major benefit.
These combined strengths make the software a compelling choice. It empowers teams with self-service access to insights and improves metric shareing across the organization.
The Cons: Where Users Hit Friction
Despite its strengths, several areas of friction are consistently noted in customer reviews and hands-on use. Awareness of these potential issues helps businesses plan their implementation and set realistic expectations for the platform’s capabilities.
These points of friction can affect the overall service reliability and the trustworthiness of reports. They are important to consider during your evaluation.
Cost Can Escalate Quickly with Added Data Sources
A primary point of friction is the pricing model. The cost can escalate quickly as you add data sources beyond the limited number included in each plan.
Each extra source incurs a monthly fee. This impacts budget predictability for growing teams. It is a major cost driver for many accounts.
Template and Connector Reliability Concerns
Users report concerns about the reliability of some pre-built templates and native connectors. Widgets can stop pulling data, requiring manual repairs.
This leads to blank charts and re-authentication steps. It compromises data accuracy and adds to manual workload. The setup process is fast initially, but maintaining integrations requires ongoing attention.
Limitations in Advanced Data Blending and Dimensions
The platform has constraints in advanced data blending and dimensional analysis. Custom metrics are often restricted to a single dimension per data source.
This hinders complex cross-tabulation. It can limit the depth of analysis for sophisticated business needs. The tool‘s interface can feel cumbersome during deep customization.
Inconsistent Customer Support Experiences
Inconsistent customer support is a recurring theme. Reviews cite slow response times, unresolved tickets, and a lack of proactive communication.
The performance of the support system is inconsistent. Priority access is largely reserved for higher-tier plans. This leaves other users with slower resolution for critical issues.
Overcoming these limitations requires a steeper learning curve. Allocating resources for troubleshooting is a smart way to manage these potential friction areas.
Ease of Use: How Intuitive is the Platform?
The true test of any analytics software lies in how quickly and intuitively users can derive value from it. A platform must balance powerful analysis with a straightforward interface that doesn’t require a manual.
This evaluation focuses on the day-to-day use experience. We look at building dashboards, learning advanced tools, and managing reports across teams.
The Drag-and-Drop Dashboard Builder
The core of the user experience is the visual dashboard designer. This interface lets you add, resize, and rearrange charts with simple mouse actions.
You can change visualization types and color-code numbers easily. The initial setup for a basic dashboard is remarkably fast, often taking just minutes.
Pre-built templates and one-click data source connections accelerate this process. The system houses all key functions—dashboards, reports, goals, and alerts—in one central place.
This reduces the need to switch between different applications. It streamlines performance tracking and communication.
Learning Curve for Advanced Customization
While basic creation is intuitive, a noticeable learning curve exists for advanced work. Tasks like building complex custom metrics or using the Datasets feature require more steps.
Some powerful actions are hidden in nested menus. This can slow down the process for power users who need advanced configurations.
The platform is designed for accessibility first. It empowers non-technical teams to share data and insights through simple links.
However, achieving deep, blended analysis demands more familiarity with the tool‘s logic. This is the trade-off for a way of working that prioritizes broad access.
Managing and Editing Reports at Scale
A significant consideration for growing teams is report management. The platform lacks a true master template system.
Cloning a dashboard creates an independent copy. Subsequent changes to the original are not synced to the clones.
For teams managing multiple client accounts or departments, this creates manual overhead. Each edit must be duplicated across numerous reports.
This impacts operational efficiency and increases the time spent on maintenance. It is a key factor for organizations with large-scale reporting needs.
Automated alerts and scheduled reports help with communication. Yet, the manual effort in core dashboard management is a notable friction point in certain areas.
Overall, the speed of initial dashboard creation is a major strength. Teams should plan for the management overhead that comes with scaling their usage.
Integrations and Data Connectivity
The real-world value of a BI tool is unlocked through its integrations. These bridges connect disparate data sources into a unified analysis portal.
This system pulls information from marketing, sales, and financial platforms. A robust connection strategy is the backbone of reliable performance tracking.
Teams must evaluate both breadth and stability. The right setup ensures data flows smoothly to support timely decisions.
Breadth of Native Integrations
The platform offers a wide range of over 120 native integrations. These connect directly to popular business applications.
This extensive library covers major data providers in key operational areas. It includes tools for advertising, CRM, web analytics, and support.
Such breadth simplifies the initial connection process. Teams can often link critical sources with just a few clicks.
Stability and Maintenance of Connectors
However, connectivity breadth is only one part of the equation. The stability of these connectors is equally critical for daily use.
User reports indicate periodic issues where integrations break. Authentication tokens can expire, causing dashboards to display blank charts.
This requires manual reconnection steps, impacting efficiency. The service‘s public Status Page reports high uptime metrics.
Yet, real-user experiences sometimes note reliability concerns. Effective connection management is key to maintaining trust in the data.
Unstable links can increase support needs and undermine report accuracy. Teams should plan for occasional maintenance.
Options for Custom Data: API, Sheets, and CSV
For data sources without a native connector, several custom paths exist. The platform provides a REST/Push API for sending custom JSON payloads.
Direct connections to Google Sheets or Excel files offer another way. CSV file uploads serve as a straightforward export and import method.
This flexibility is a major strength for businesses with unique needs. However, the custom data path has notable challenges.
Using the official API and SDKs can be difficult. Reports mention bare-bones documentation and complex installation steps.
Slow customer support responses can further delay technical resolutions. This often requires dedicated developer resources.
Evaluating integration breadth against your required stability is crucial. It determines if the software fits your specific data ecosystem.
Data Organization, Filtering, and Blending
Filtering and blending data sources accurately determines the depth and reliability of your performance analysis. The right software provides features to structure raw information into clear metrics.
This process turns chaotic numbers into actionable intelligence. It is a core feature for any business intelligence tool.
Creating Custom Metrics with Metric Builder
The Metric Builder is a powerful feature for custom calculations. It lets users combine data from multiple sources into new key performance indicators.
This way of working supports complex formulas. You can create blended metrics without coding knowledge.
The interface is designed for use by non-technical teams. It streamlines the setup of calculated KPIs.
This power enhances reporting and tracking capabilities. Teams gain better access to insights tailored to their needs.
Understanding the Limits of Dimensions and Joins
A significant limitation exists in dimensional analysis. For most data sources, custom metrics can only use one dimension at a time.
This restricts multi-dimensional slicing without creating duplicate metrics. It can hinder complex cross-source analysis.
The system does not support true relational data blending. Joins on shared keys like campaign names are not available.
These constraints mean users may need workarounds for advanced models. Understanding these boundaries is key for realistic expectations.
Datasets for Advanced Data Preparation
The Datasets feature serves as an advanced preparation tool. It enables pulling raw records into a spreadsheet-like interface.
Users can apply filters, merge tables, and calculate new columns. This process cleans and standardizes data before visualization.
It improves the accuracy and consistency of metrics in dashboards. The power lies in its ability to handle messy data.
However, achieving true data model-level blending remains a challenge. The platform focuses on accessibility over complex relational management.
For businesses with simple needs, this efficiency is a major advantage. Teams in complex areas may find the limits restrictive.
Proper data organization is essential for trustworthy insights. This service provides strong tools for basic to intermediate usage.
Evaluating your specific integration and analysis steps is crucial. It ensures the tool fits your data ecosystem and place in workflows.
Reporting and Dashboard Sharing Capabilities
Effective reporting transforms raw data into compelling narratives that drive action and accountability. The right software provides powerful features to design, distribute, and brand these insights.
This streamlines the entire communication process. It ensures key performance metrics reach stakeholders in a format they prefer.
Designing Client-Ready Reports and Dashboards
Creating polished, professional deliverables is straightforward. The drag-and-drop interface and library of templates accelerate setup.
You can customize layouts, colors, and chart types to match your business identity. This feature is essential for external stakeholder communication.
The tool supports detailed analysis within the reporting environment. You can drill into specific data points directly from the dashboard.
This way of working enhances clarity for users. It turns complex data sets into clear visual stories.
Automated Delivery and Real-Time Sharing
Manual report distribution wastes valuable time. Automated systems eliminate this inefficiency.
You can schedule reports for email or PDF export at regular intervals. This ensures consistent updates without manual effort.
Real-time share links and embed codes offer another access method. Stakeholders can view live dashboards in a web browser or on a TV display.
Embedding a dashboard into an internal portal or client site is also possible. This provides always-current status updates.
Secure permission settings control access to sensitive data. It protects account information while enabling broad shareing.
White-Labeling and Branding Options
For agencies and consultants, brand consistency is critical. White-labeling features help maintain a professional image.
Custom logos, color schemes, and domain names are available. These options are particularly strong within the specialized Agency program.
Full white-labeling may require an add-on service. It allows for a completely branded client portal experience.
This management capability is a powerful tool for scaling client services. It improves efficiency and strengthens client relationships.
Evaluating these features is crucial for businesses with specific branding needs. The platform’s integration with your data sources supports a seamless workflow.
Ultimately, robust reporting and shareing capabilities close the loop on data-driven decision-making. They ensure insights lead to action.
Customer Support and Resources
For teams relying on live client reports and real-time performance tracking, delays in resolving technical issues can directly impact business outcomes and client trust. The strength of a platform’s support system is a critical component of the overall service experience.
When a data connector fails or a dashboard displays errors, efficient help resources become invaluable. This evaluation covers the available channels, response times, and documentation quality.
Available Support Channels and Response Times
The software provides multiple avenues for assistance. A 24/7 AI chatbot handles common questions instantly, offering a first line of defense.
Live human chat is available for over 13 hours on weekdays. Email ticketing serves as the primary method for detailed technical issues.
User reviews, however, report inconsistent experiences with these channels. Slow response times and unresolved tickets are frequent points of criticism.
This variability can affect teams operating on tight deadlines. The speed of resolution is crucial for maintaining reporting workflows.
Quality of Help Documentation and Community
An extensive Help Center provides detailed articles on most features and setup processes. This self-service resource is well-organized and can answer many common questions.
A user Community forum offers a place for peer-to-peer advice. Members can share tips and workarounds for specific use cases.
The activity level in the Community can vary. For complex analysis or integration problems, the documentation may not provide enough depth.
Teams often need to combine help articles with direct support. This multi-step approach is the most reliable way to solve advanced issues.
Priority Support for Higher Tiers
The level of support you receive is tied directly to your account tier. Priority support is a feature reserved for Premium plan accounts.
This upgraded service includes access to a named success engineer and a dedicated analyst. These experts provide proactive guidance and faster resolution times.
For lower-tier accounts, this personalized service is not available by default. It can be added as a paid upgrade, but it represents an additional cost.
Businesses with mission-critical reporting needs should consider this tiered structure. The difference in support access can significantly impact operational efficiency.
Evaluating your team’s tolerance for potential delays is essential. The right support plan ensures your data analysis tool remains a reliable asset.
Security, Compliance, and Data Integrity
Trust in a data analytics service hinges on its ability to protect information and maintain constant availability. For any business intelligence tool, robust security and clear compliance are not optional. They are the foundation of reliable performance tracking and decision-making.
Organizations must verify these features before trusting a platform with sensitive data. This evaluation covers encryption standards, uptime metrics, and adherence to regulations.
Platform Security and Encryption Standards
The software is built on Amazon Web Services infrastructure. This provides a secure and scalable foundation for all user accounts.
Industry-standard measures protect data at every stage. AES-256 encryption safeguards information at rest. TLS (Transport Layer Security) secures data in transit between your sources and the system.
Virtual Private Cloud isolation adds another layer of defense. It ensures your data remains separated from other customer environments.
Continuous 24/7 monitoring watches for unusual activity. Quarterly penetration testing probes for potential vulnerabilities.
This proactive process helps maintain a strong security posture. It is a critical feature for maintaining data integrity.
Uptime Performance and Reliability Metrics
Consistent access is vital for daily usage. The platform’s operational status is transparent through a public Status Page.
This page reports real-time and historical system health. Over a recent 90-day period, it showed impressive metrics.
Connector uptime was at 100%. The main web application uptime reached 99.98%.
These numbers indicate high reliability for performance tracking. However, individual user experiences with specific integrations can vary.
Teams should monitor this page for alerts about maintenance or issues. It is a smart way to stay informed.
Compliance with GDPR and Other Standards
For companies in regulated areas, formal certifications are essential. The service complies with the General Data Protection Regulation (GDPR).
This ensures proper handling of personal data for European users. It also inherits key certifications from its AWS foundation.
These include ISO 27001, SOC 1, 2, and 3, and PCI-DSS. The platform is actively pursuing its own SOC 2 Type II attestation, expected in 2025.
This commitment to compliance provides assurance for businesses with strict needs. It simplifies management and reporting in complex regulatory landscapes.
Regular audits and the integration of best practices contribute to this. They build trust in the platform’s data handling process.
Overall, the platform offers a powerful and secure environment. It balances strong protection with high efficiency for analysis.
Enterprises should still verify that all specific regulatory needs are met. This due diligence is a key step in the selection process.
Who is Databox Best For?
Selecting the right analytics software is about matching its core strengths to the specific needs and workflows of your team. Not every business intelligence tool fits every organization.
This platform delivers maximum value for specific user profiles. Its design prioritizes efficiency, self-service, and clear communication.
Understanding which group you belong to is a key step. It determines if the features align with your primary goals for data tracking and reporting.
Marketing Agencies and Consultants
This group finds exceptional value in the platform’s multi-client management capabilities. The ability to create standardized, white-labeled reports for numerous accounts is a major feature.
It frees up billable hours previously spent on manual reporting. Unlimited client workspaces and automated delivery streamline the entire process.
A dedicated client overview page helps quickly spot accounts that need attention. This improves account management and client communication.
The specialized Agency program enhances this efficiency. It provides reusable templates and a branded client portal experience.
Small to Midsize Business Teams
Small and midsize teams benefit from the platform’s affordability and ease of use. It consolidates data from various providers without needing a dedicated analyst.
The intuitive interface allows team members to build dashboards themselves. This empowers teams with self-service data access.
It fosters a data-driven culture in a shared place. Teams can track goals and metrics relevant to their areas.
The software‘s flexibility suits a wide range of business sizes. Its sweet spot is clearly where cost-effectiveness meets powerful analysis.
Executives and Functional Leaders
Executives and leaders appreciate real-time dashboards and automated alerts. These provide an at-a-glance view of company performance in one place.
This way of working keeps them informed for timely decisions. They see changes as they happen without waiting for reports.
The system offers a single source of truth for key metrics. It simplifies the communication of results across departments.
Leaders can build reports without waiting for technical support. This speed to insight is crucial for agile management.
Business Analysts Seeking Efficiency
Analysts use the platform to streamline their workflow and remove bottlenecks. They can build dashboards faster than with complex enterprise solutions.
The tool empowers other team members with self-service access. This allows analysts to focus on deeper analysis.
Features like the Metric Builder and Datasets handle data preparation. This reduces manual steps and improves efficiency.
It addresses the specific needs of analysts in fast-paced areas. The balance of power and intuitive design is key.
Identifying your user profile is essential. It helps determine if Databox will meet your expectations and deliver a strong return.
The platform excels for agencies, SMBs, leaders, and analysts. These groups benefit most from its specific integration of features and interface design.
How Databox Compares to Legacy BI and DIY Solutions
Businesses choosing a business intelligence strategy today face a fundamental choice between traditional, heavyweight systems and modern, agile platforms. This comparison focuses on three critical areas: total cost, speed to insight, and who can actually use the tool. Understanding these differences clarifies the value proposition of a subscription-based software like Databox versus legacy enterprise suites or building in-house.
Cost Comparison: Subscription vs. Enterprise Licenses
The financial model is a primary differentiator. Legacy Business Intelligence suites often require large enterprise licenses. For a team of 25 users, annual fees can exceed $30,000, plus hefty consulting fees for setup and customization.
Building a do-it-yourself system has hidden expenses too. Hiring a data engineer for in-house development carries an average salary cost of around $150,000 per year.
In contrast, a platform like Databox operates on a predictable subscription model. The Professional plan costs $159 per month billed annually. It includes unlimited users, removing per-seat fees. Additional data sources are a manageable $5.60 each per month.
This transforms a major capital expense into an operational one. It offers substantial power and flexibility for most business reporting needs without the large upfront outlay.
Speed to Insight: Implementation Time
Time-to-value is dramatically faster with an agile software solution. Teams can deploy a share-ready dashboard in as little as 5 to 15 minutes after connecting data.
This speed stems from a streamlined, user-driven setup process. It uses pre-built templates and one-click integrations. Traditional BI projects often take weeks or months of planning and development.
The lengthy consulting engagements common with legacy tools are eliminated. This agility allows organizations to implement performance tracking rapidly. They can respond to changes in the business environment without delay.
Empowering Non-Technical Users
A key differentiator is user empowerment. Legacy systems often create a dependency on IT or data specialists. Team members must request reports and wait for support.
Modern platforms focus on no-code analytics. They provide visual data preparation and drag-and-drop design. This interface gives non-technical staff direct access to insights.
Users can build their own dashboards and perform analysis without writing SQL. It fosters a data-driven culture across all departments. This self-service model improves efficiency and communication.
While legacy BI might offer deeper customization for extreme complexity, the agile tool serves most needs effectively. It prioritizes accessibility and actionable intelligence over cumbersome features.
Implementation and Getting Started
The moment you decide to implement a new analytics platform, speed to value becomes your top priority. A smooth, fast setup process ensures your team can begin tracking performance without delay. This phase turns a powerful software investment into immediate operational gains.
Following a clear series of steps streamlines onboarding. It helps new users quickly realize value from the tool. The right approach minimizes time from sign-up to actionable insight.
How Fast Can You Go Live?
Implementation with this platform is notably fast. The company promises users can build their first dashboard in five minutes or less.
Many teams report going live with a share-ready dashboard within 5 to 15 minutes. This speed is a major advantage for addressing reporting needs quickly.
It allows businesses to begin performance management without a protracted setup time. The intuitive interface is designed for this rapid deployment.
Best Practices for Onboarding Your Team
Start with a pre-built template relevant to your industry. This accelerates the initial setup and ensures consistency.
Gradually connect your most critical data sources. Avoid unnecessary complexity at the start by planning which key metrics are most important.
Invite team members with role-based permissions to explore. Successful onboarding involves training on how to use the dashboard builder.
Team members should learn to interpret the data and utilize shareing features. This fosters effective communication of insights across the organization.
Connecting Your First Data Sources
The initial setup process involves accessing the web portal. You select and authorize your first data sources from the extensive library.
Over 130 native integrations are available. The platform guides you through the connection process with just a few clicks.
Authorizing an account and mapping metrics are straightforward steps. The system then begins to sync initial data automatically.
Allowing the platform to pull in performance data creates a live foundation for analysis. This way of working puts information in one central place.
Following the connect, visualize, share sequence streamlines onboarding. It helps new users realize value from the software rapidly.
By following these guidelines, organizations minimize the time to insight. They accelerate their journey toward more data-driven decision-making.
What Real Users Say: Analyzing Reviews and Feedback
User reviews cut through marketing to reveal a tool’s real-world performance. Feedback from platforms like G2 and Capterra provides a transparent look at daily use. This analysis highlights what works and where teams encounter friction.
Overall sentiment is strongly positive. The software holds high ratings of 4.4 stars on G2 and 4.7 stars on Capterra. These scores indicate general satisfaction with the core service.
Yet, detailed testimonials show a more nuanced picture. Common themes emerge across thousands of user reports. Understanding this feedback is crucial for setting realistic expectations.
Positive Trends from G2 and Capterra
Reviewers consistently praise several key strengths. Ease of use is the most celebrated feature. New users highlight how quickly they can build their first dashboard.
The breadth of integrations is another major plus. It pulls data from many sources into one central place. This simplifies performance tracking and reporting.
An extensive library of pre-built templates saves significant time. Teams deploy professional dashboards without starting from scratch. This efficiency accelerates the entire setup process.
These positive trends confirm the platform’s value for core tasks. They show why it’s a popular choice for marketing agencies and SMBs. The intuitive interface empowers non-technical staff.
Common Criticisms and Recurring Issues
Despite high ratings, specific criticisms appear repeatedly. The potential for cost escalation is a frequent concern. Adding extra data sources beyond plan limits increases monthly fees quickly.
Connector reliability is another persistent issue. Some native integrations can break, causing dashboards to display blank charts. This requires manual reconnection steps and hurts data accuracy.
Inconsistent customer support experiences form a third major complaint. Users report slow response times and unresolved tickets. This lack of reliable support can delay critical issue resolution.
These recurring problems point to areas where the service could improve. They affect the trustworthiness of live reports and daily usage. Teams must account for potential maintenance overhead.
The “Yes, But…” Pattern in User Sentiment
A distinct pattern emerges in detailed feedback. Users often praise a feature but immediately note a drawback. This “Yes, but…” sentiment signals nuanced satisfaction.
For example, many say setup is easy and fast. Then they add that advanced customization has a steeper learning curve. The tool is great for basics but shows limits with complex needs.
Another common pattern praises dashboard creation speed. The caveat follows about challenges in managing reports at scale. Cloning dashboards creates independent copies, not linked templates.
This pattern reveals the platform’s sweet spot. It excels at providing quick, visual access to data. Users hit friction when pushing beyond standard usage into advanced analysis.
For potential customers, this insight is invaluable. It means weighing strong foundational features against reported operational challenges. Setting expectations around these changes is key.
Tracking reviews over time shows these themes are persistent. They offer a honest look at the system‘s day-to-day performance. This feedback is crucial for informed decision-making.
Conclusion: Is Databox the Right BI Tool for You?
Deciding on the right analytics platform is less about finding a perfect tool and more about identifying the best fit for your specific operational needs.
This software delivers exceptional efficiency for marketing agencies, SMBs, and non-technical users who value rapid setup and intuitive access to insights. Its strength lies in streamlining the reporting process and improving team communication around key performance metrics.
However, teams with complex data modeling requirements or a very high number of sources may find its analysis limits constraining. Consider your tolerance for the reported inconsistencies in connector reliability and customer support.
The fastest way to know is to test it. We recommend using the free plan to see if Databox aligns with your business workflow before committing.
FAQ
What are the main pricing tiers?
The service offers a free plan for basic testing, followed by Starter and Professional tiers for growing teams. For advanced needs, Growth and Premium plans provide enterprise-grade features. Agencies can also join a dedicated partner program.
How easy is it to build a dashboard?
The drag-and-drop builder is highly intuitive, allowing for rapid setup. Most users can connect data and create a visual report very quickly. However, advanced customization, like complex data blends, has a steeper learning curve.
Can I connect my own data sources?
A> Yes. Beyond the 130+ native integrations, you can bring in custom data through APIs, Google Sheets, or CSV uploads. This flexibility lets you track performance from virtually any reporting source or internal system.
What are the limitations of the data blending tools?
While the Metric Builder is powerful for creating custom calculations, there are constraints. Joining data from different providers on multiple dimensions can be challenging, which may limit some advanced analysis workflows for power users.
How reliable are the pre-built templates and connectors?
The extensive template library is a major strength for speed. However, some users report that certain connectors can break after updates to the source software, requiring maintenance that can temporarily disrupt data flow.
What customer support can I expect?
Support experiences vary. While documentation and a community forum are available, direct response times can be inconsistent on standard plans. Priority support is a key feature included with the higher-tier subscriptions.
Is the platform secure for client data?
A> Yes. It employs strong encryption standards for data in transit and at rest, maintains high uptime performance, and complies with regulations like GDPR. This makes it suitable for handling sensitive business and customer information.
Who benefits most from using this software?
Marketing agencies and consultants find great value for client reporting. Small to midsize business teams, executives tracking KPIs, and analysts seeking efficiency in daily reporting also see significant improvements in their process.