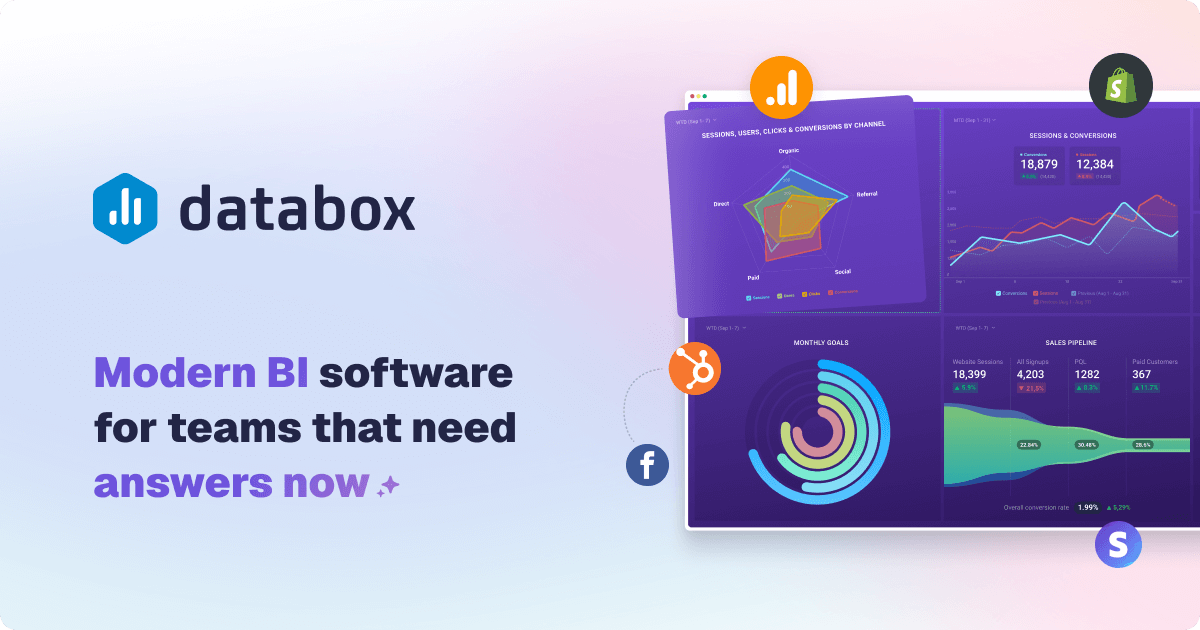
Databox is an analytics platform that connects data from more than 130 tools into live dashboards, KPI tracking, and automated insights. For a program or M&E team pulling numbers from a CRM, a spreadsheet, and a survey tool separately, it consolidates them into one dashboard that updates on its own instead of a manually rebuilt report.
Key features
- AI Analyst (Genie): ask plain-language questions and get answers pulled from live connected data
- Customizable dashboards and reports for tracking KPIs
- A governed semantic layer that keeps metric definitions consistent across the organization
- Integrations with CRMs, marketing platforms, databases, spreadsheets, and APIs
- Automated routines and agents for recurring analysis tasks
- Anomaly detection that flags unusual metric movement automatically
Pricing
| Plan | Price | Includes |
|---|---|---|
| Free | $0/mo | 1 user, 3 data sources, 50 AI credits/mo |
| Analyst | $71/mo | 1 user, 5 data sources, 150 AI credits/mo |
| Team (Core) | $199/mo | 3 users, 10 data sources, 500 AI credits/mo |
| Team (Scale) | $319/mo | 10 users, 30 data sources, 1,000 AI credits/mo |
| Agency | $99/mo | Unlimited users, 20 data sources, 300 AI credits/mo |
Prices shown are monthly; annual billing offers a 20 percent discount. A Custom plan is available for larger implementations. Prices change over time. Figures above are based on Databox’s own pricing page.
Pros and cons
| Pros | Cons |
|---|---|
| The Free plan with 3 data sources is enough to pilot a real dashboard before paying anything | Data source caps on lower tiers mean a program pulling from many systems will need a paid tier fast |
| A governed semantic layer prevents different staff from defining the same KPI two different ways | AI credits are metered per plan, heavy use of the AI Analyst can require an upgrade |
| Anomaly detection can flag a data problem or an unusual program result before a funder asks about it | Team tiers priced per named user get expensive for a program with many stakeholders needing dashboard access |
Who it’s best for
A program or M&E team already pulling data from multiple systems (a CRM, a survey tool, a spreadsheet) that wants one live dashboard instead of a manually rebuilt monthly report.
Skip it if your reporting draws from a single source already, a native dashboard in that one tool likely covers the need without adding another subscription.
How to get started
Start on the Free plan, connect your three most-used data sources, and build one dashboard tracking your core program KPIs before deciding whether you need more sources or users.
FAQ
Can Databox pull data from a CRM and a spreadsheet at the same time? Yes. It connects to more than 130 tools, including CRMs, spreadsheets, and databases, in one dashboard.
Is there a free plan? Yes, with 1 user, 3 data sources, and 50 AI credits a month, enough to pilot a single dashboard.
Does Databox require technical setup? Connecting common tools is largely point-and-click, though a data source without a built-in connector may need an API or spreadsheet workaround.
Disclosure: Impact DOTS may earn a commission if you sign up for Databox through the links in this article. This does not change what you pay, and it does not influence which tools we choose to cover.